Forex & Crypto Trading EducationStrategies, Indicators & Concepts
Learn professional trading strategies used by institutional and prop firm traders. Master Smart Money Concepts (SMC), Fibonacci retracement, momentum indicators, price action setups, and rule-based risk management — with real chart examples for every strategy.
What You Will Learn
This education hub teaches the exact frameworks used by institutional and professional traders — not recycled retail theory. Every concept is explained with a real chart example, clear entry and exit rules, and the timeframes it works best on.
- ▸How to read market structure using Smart Money Concepts (SMC)
- ▸How institutions create liquidity traps — and how to trade them
- ▸Multi-timeframe analysis: Daily → H4 → H1 → M5 → M1
- ▸Precision entry models: TCISD, FVG, SMT Divergence, Turtle Soup
- ▸Position sizing, risk-reward planning and trade journalling
- ▸How to pass prop firm challenges using rule-based execution
Who This Is For
Whether you are just starting out or have been trading for years, this education is structured to move you from guesswork to a repeatable, data-driven process.
Why Institutional Trading Concepts Matter
Most retail traders lose money because they use tools designed for retail traders — lagging indicators, basic moving average crossovers, and pattern recognition that institutional algorithms are specifically engineered to exploit.
Smart Money Concepts (SMC) flips this by teaching you to read price the same way banks and hedge funds do — through order flow, liquidity pools, fair value gaps, and market structure breaks rather than surface-level signals.
Institutional traders do not chase price. They identify where liquidity is resting — above recent highs, below recent lows, at psychological round numbers — and position before the move happens. SMT Divergence, Turtle Soup, and TCISD are all tools that help you identify these setups.
When you understand why price moves rather than just what it does, every chart becomes readable. That is the shift this education is designed to create.
Built on Real Trading Experience — Not Theory
Deep Trade IQ was built by active traders who have been developing, backtesting, and deploying algorithmic and discretionary strategies since 2019 across forex, crypto, gold, and indices. Every strategy in this education hub has been backtested on real historical data, with transparent results published on the Analysis & Backtesting page. We teach only what we trade.
First Plan Your Trade – Then Trade Your Plan
A professional, rule-based trading framework focused on structure, discipline, and consistency.
📋 Plan Your Trade - Avoid Speculation
- • What is your trading EDGE?
- • Define your trading strategy and rules
- • Backtest your approach thoroughly
- • Set clear entry and exit criteria
- • Determine position sizing and risk parameters
💹 Trade Your Plan - Avoid Emotions
- • CONTROL YOUR PSYCHOLOGY
- • Execute trades according to your predefined rules
- • Maintain discipline and avoid emotional decisions
- • Track performance and journal your trades
- • Review and refine your strategy regularly
How to Use Trading Indicators Effectively
No single indicator is perfect — professional and institutional traders combine multiple tools to build high-probability setups and reduce false signals:
- ✅Confirm signals: Multiple indicators agreeing increases probability
- ✅Filter noise: Avoid false signals in choppy markets
- ✅Adapt to conditions: Different strategies for trending vs ranging markets
- ✅Manage risk: Better entry and exit timing
Reversal Indicators
Indicators that spot potential trend reversals
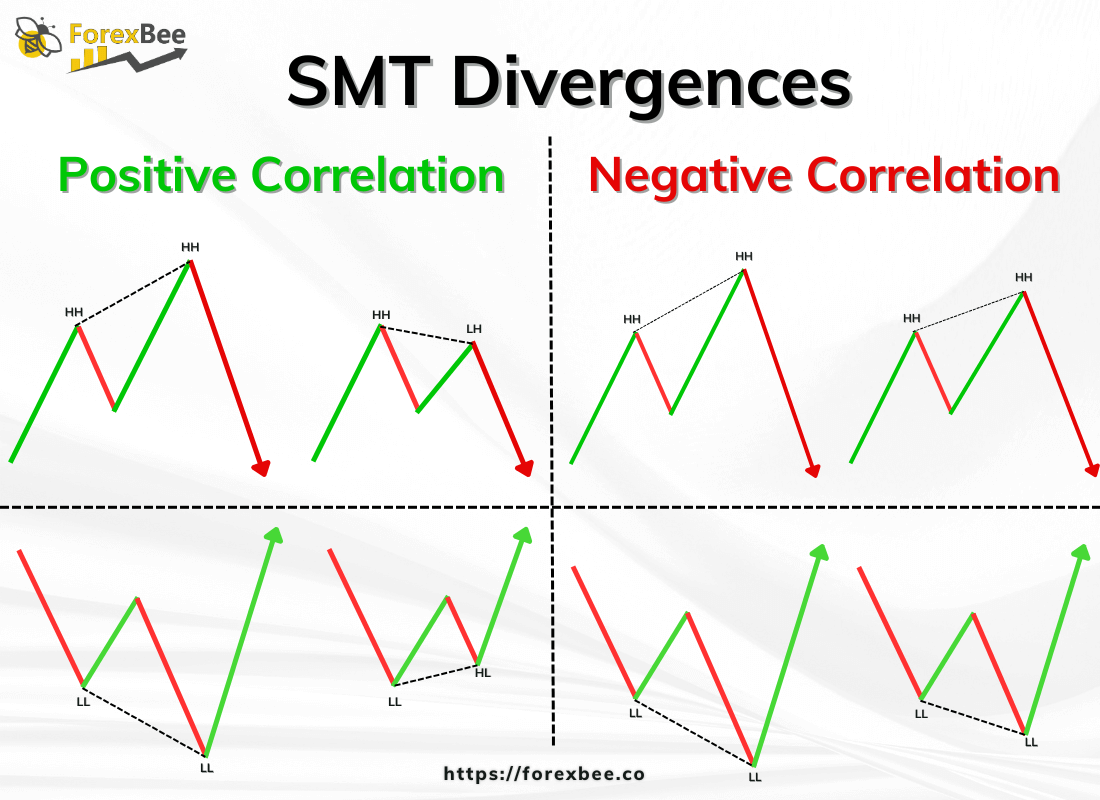
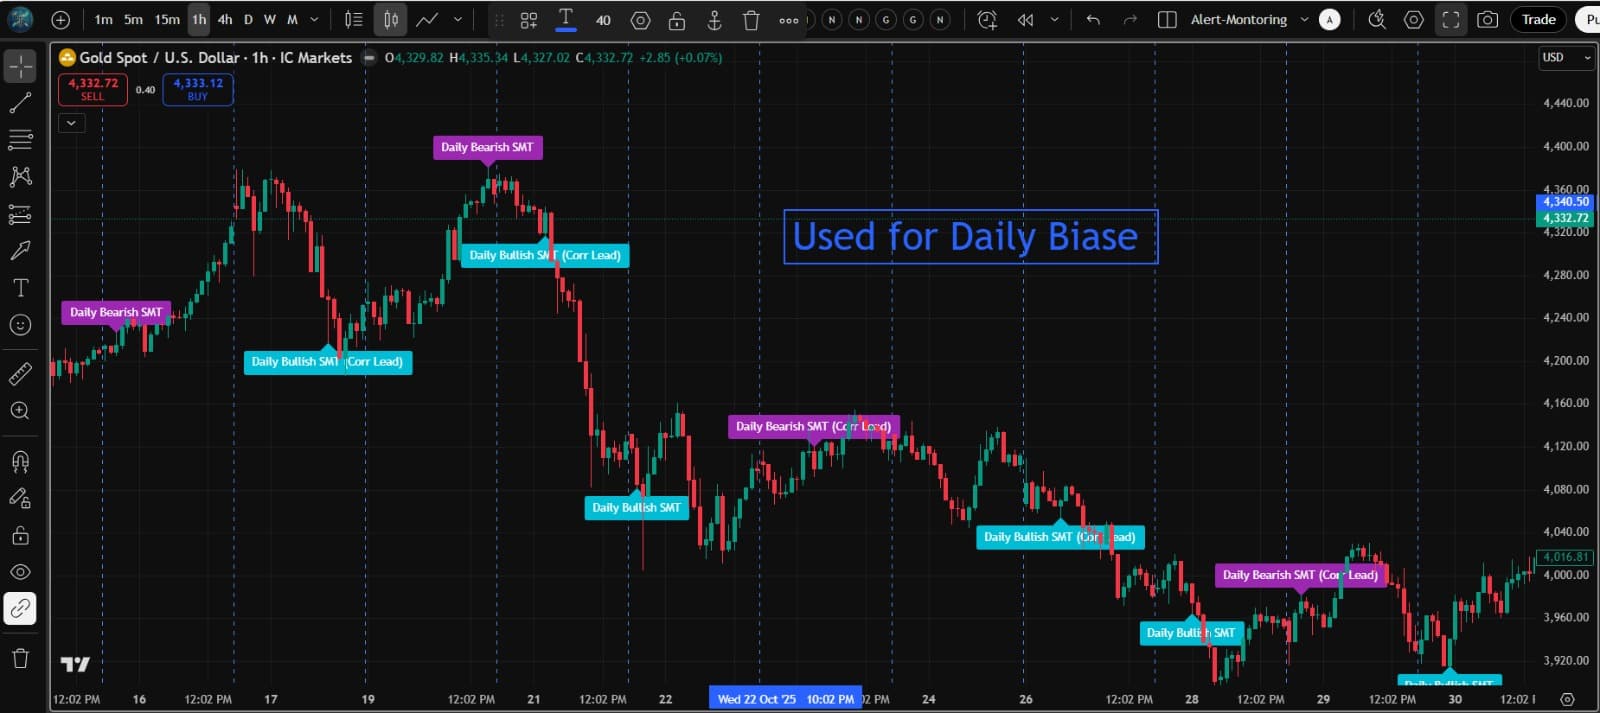
SMT Divergence
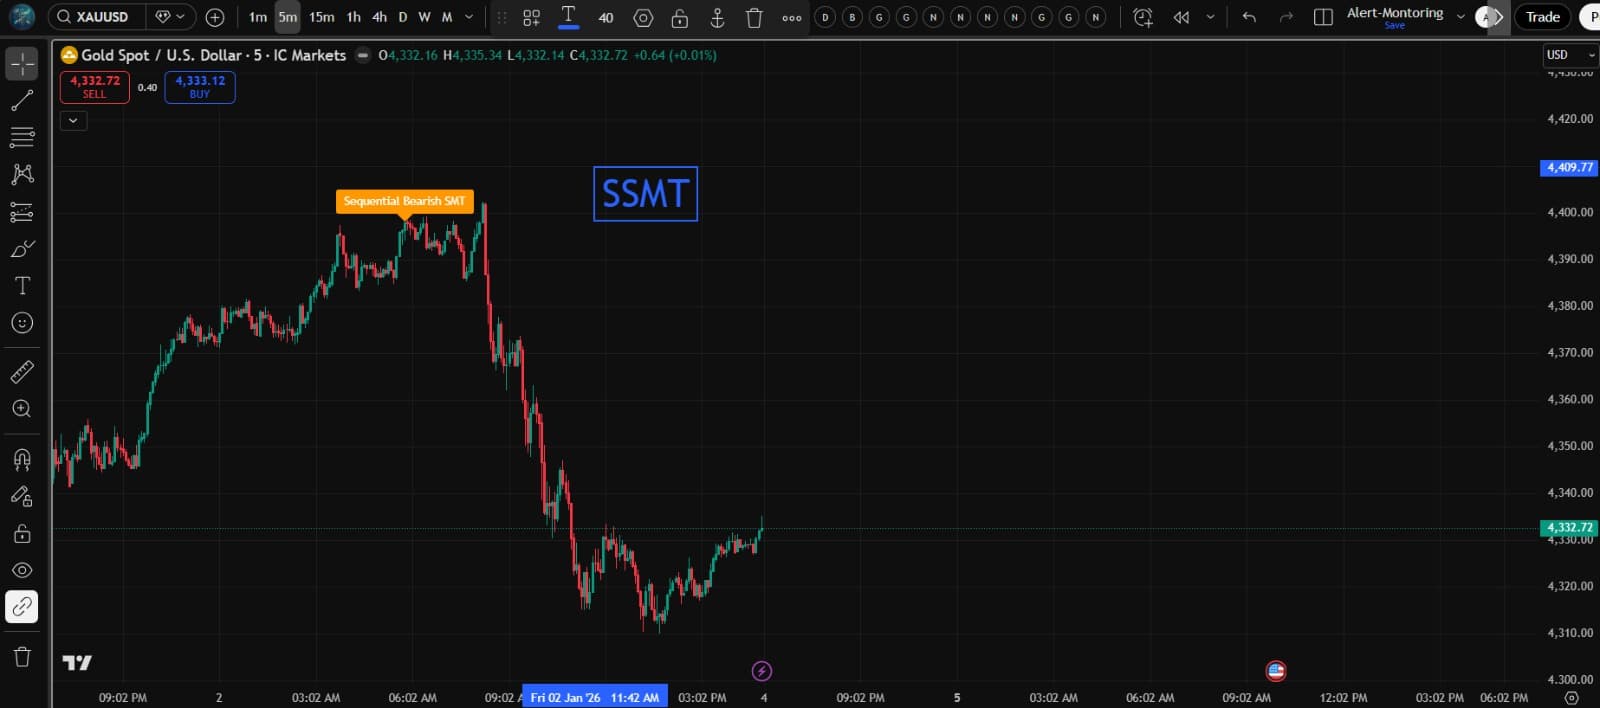
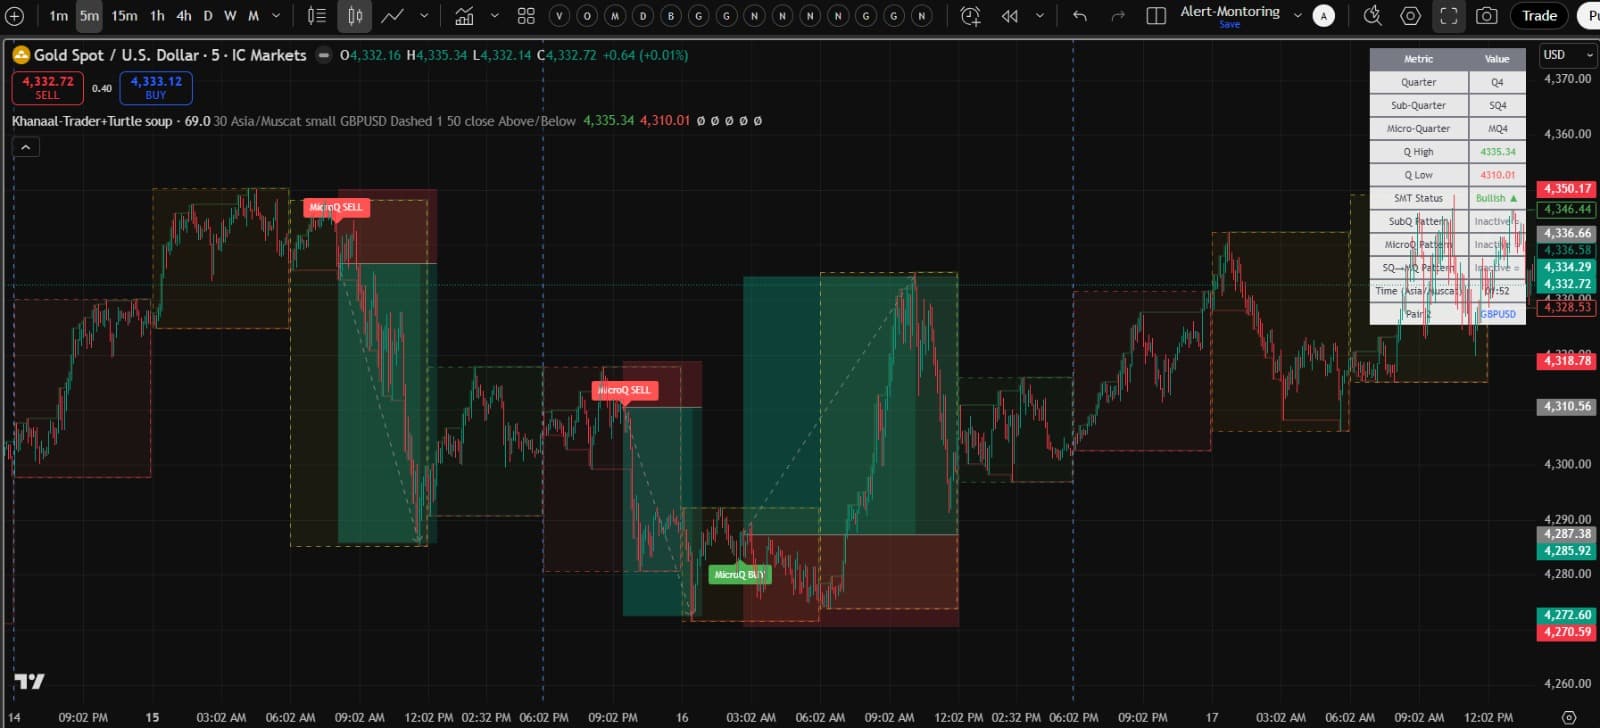
Sequential Smart Money Technique Divergence (SSMT)
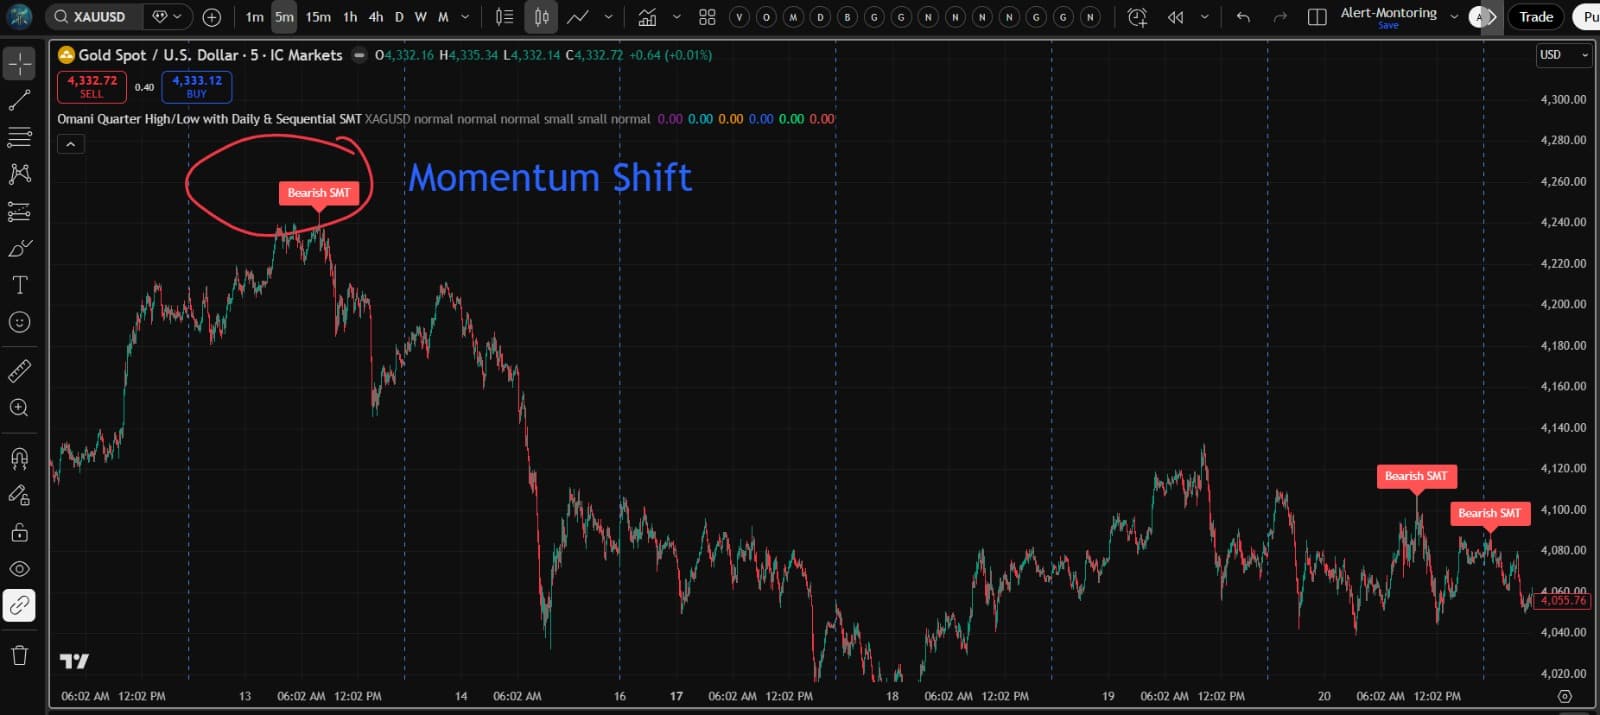
Momentum Shift
🐢 Turtle Soup Strategy
A reversal strategy designed to catch false breakouts
Turtle Soup - False Breakout
📊 Trend Following Indicators
Indicators that help identify and follow market trends
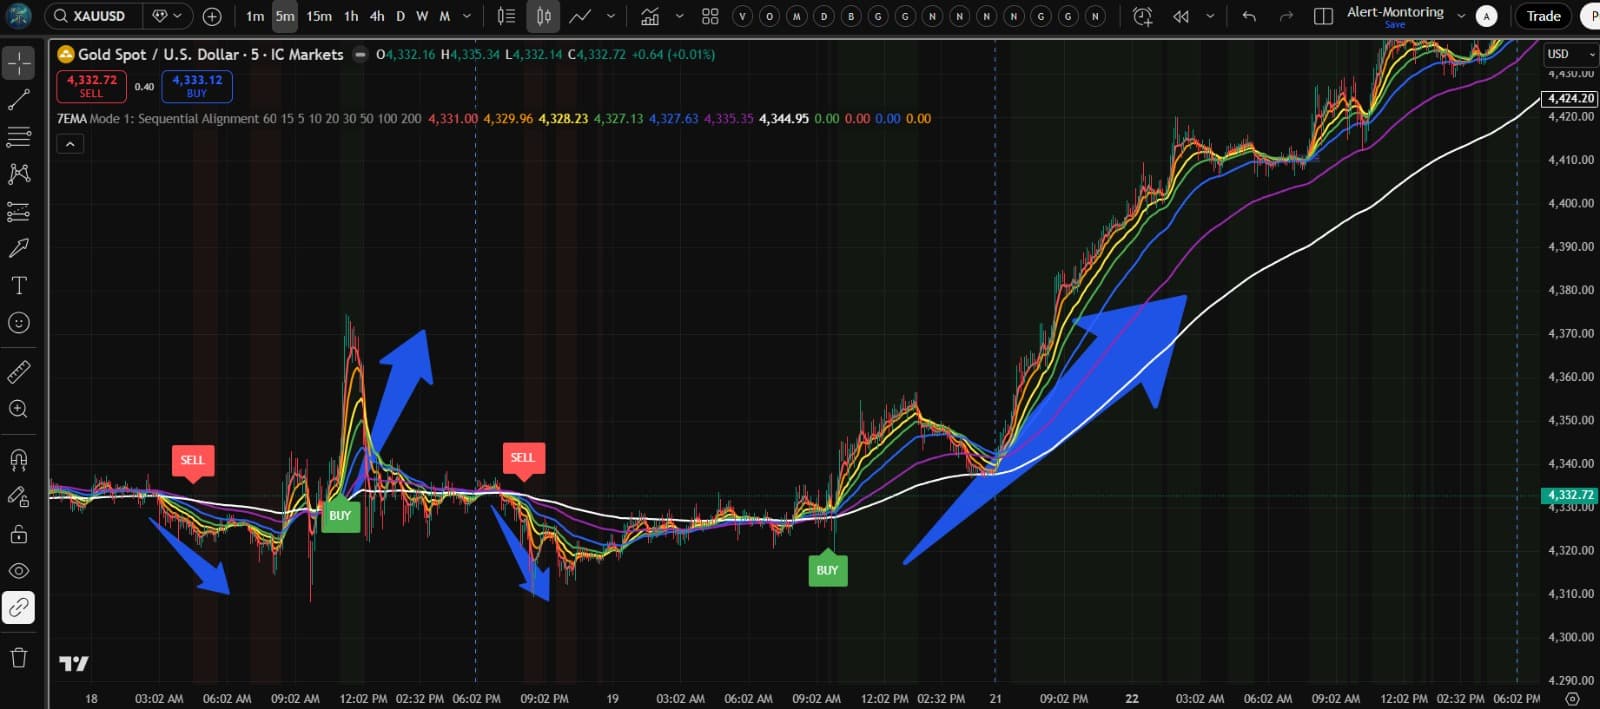
📈 7 EMAs Cross Strategy
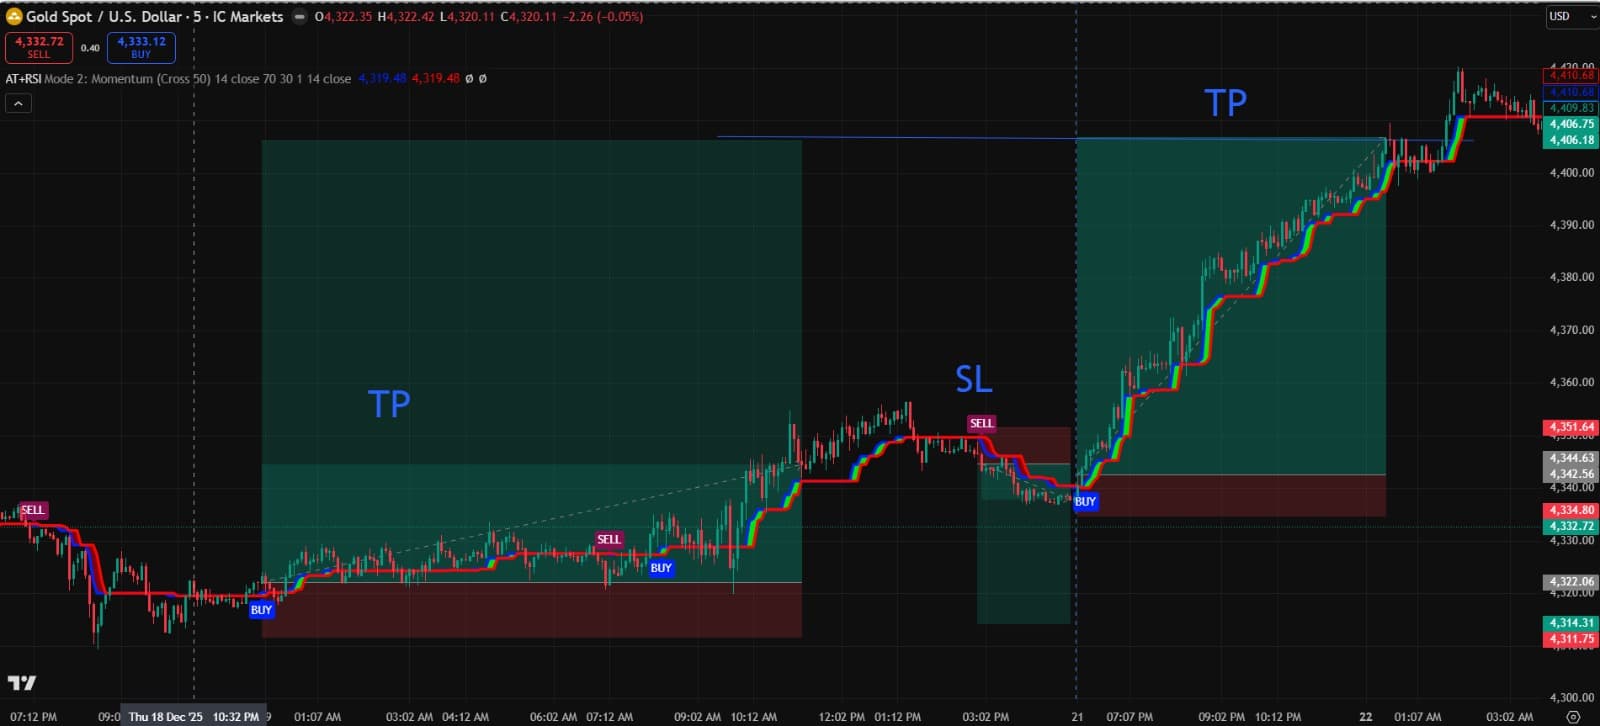
🚀 Alpha Trend + RSI Filter Indicator
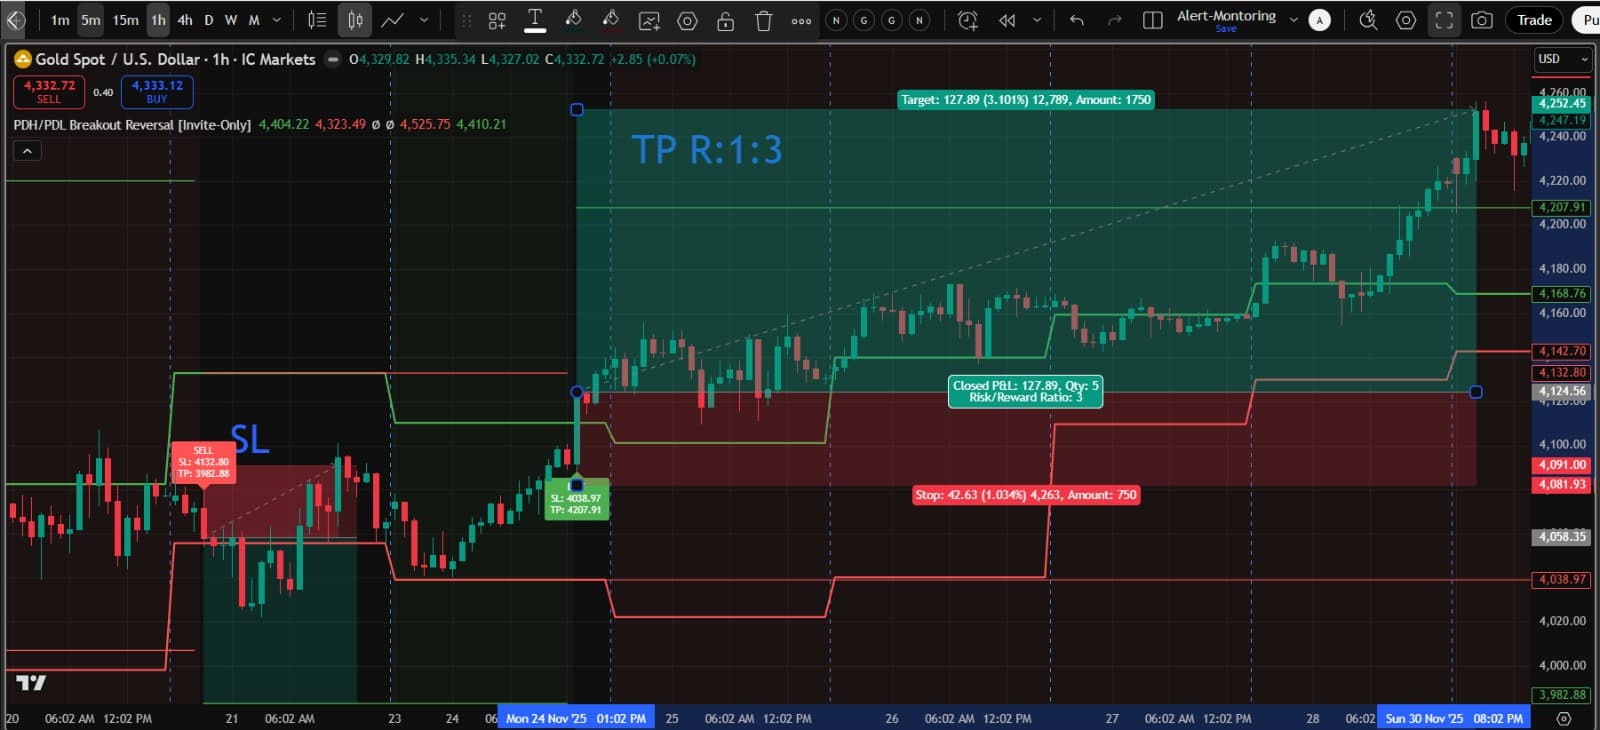
PDH/PDL Breakout
🔍 Price Action Indicators
Indicators based on pure price movement patterns
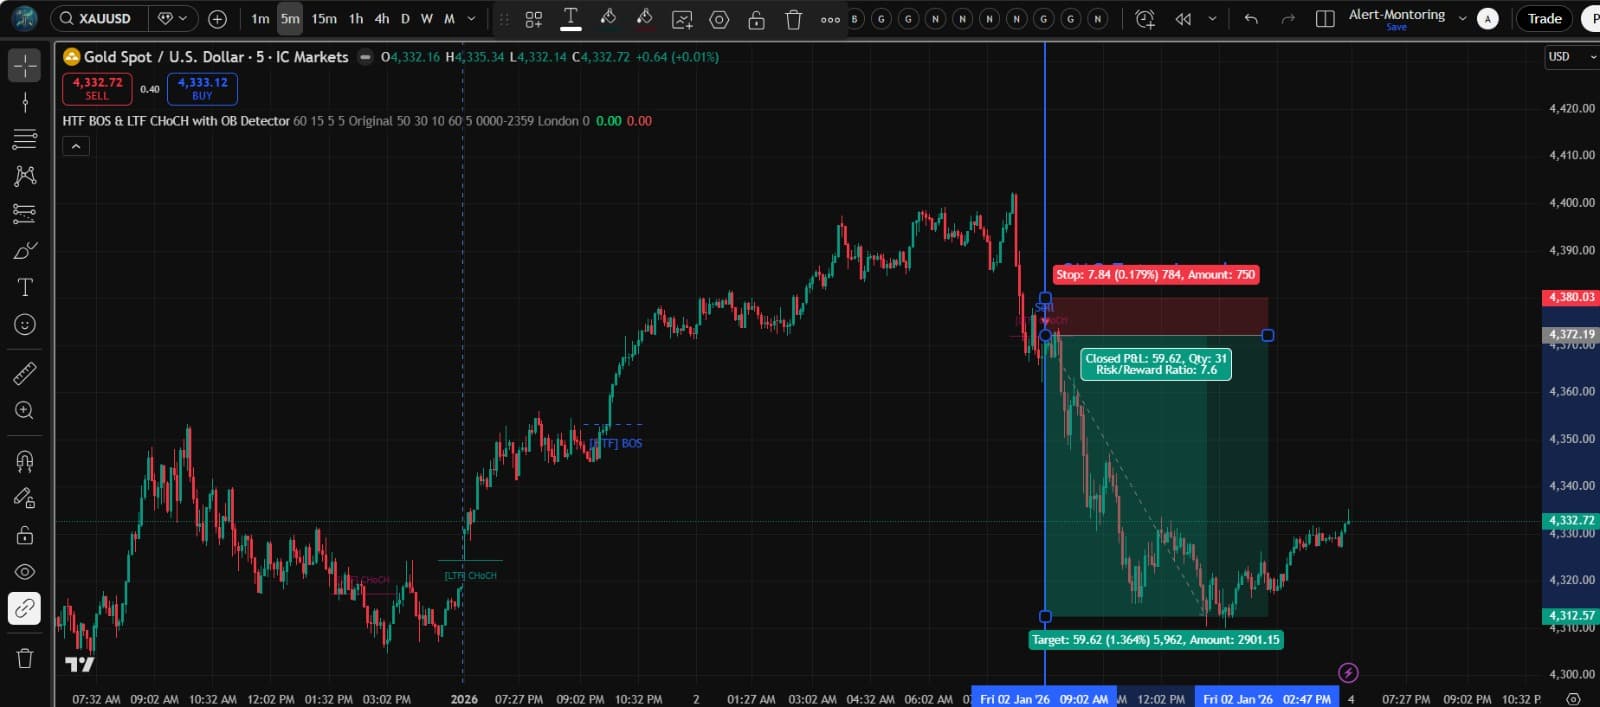
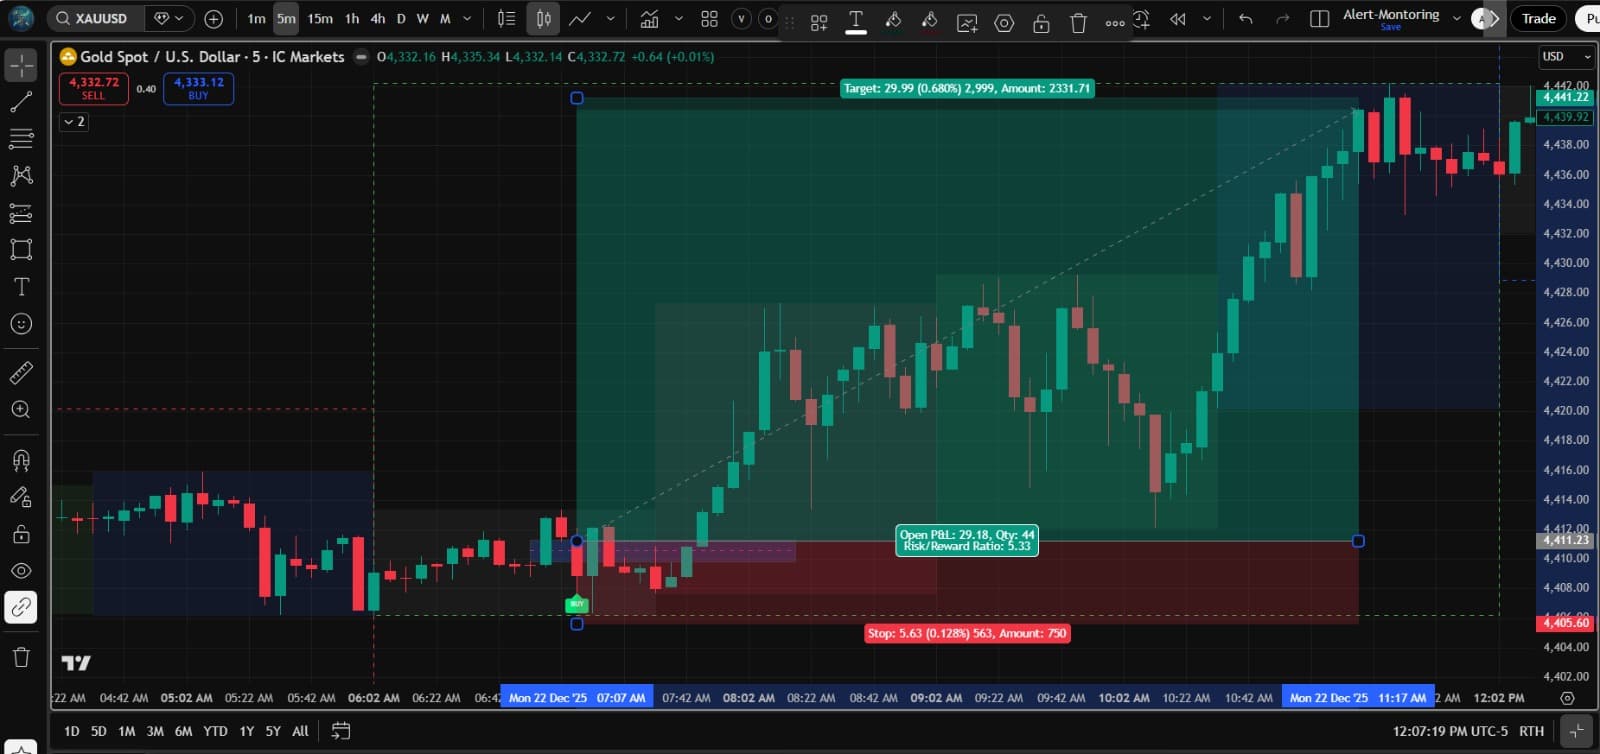
SMC Break (Smart Money Concepts)
FVG (Fair Value Gap)
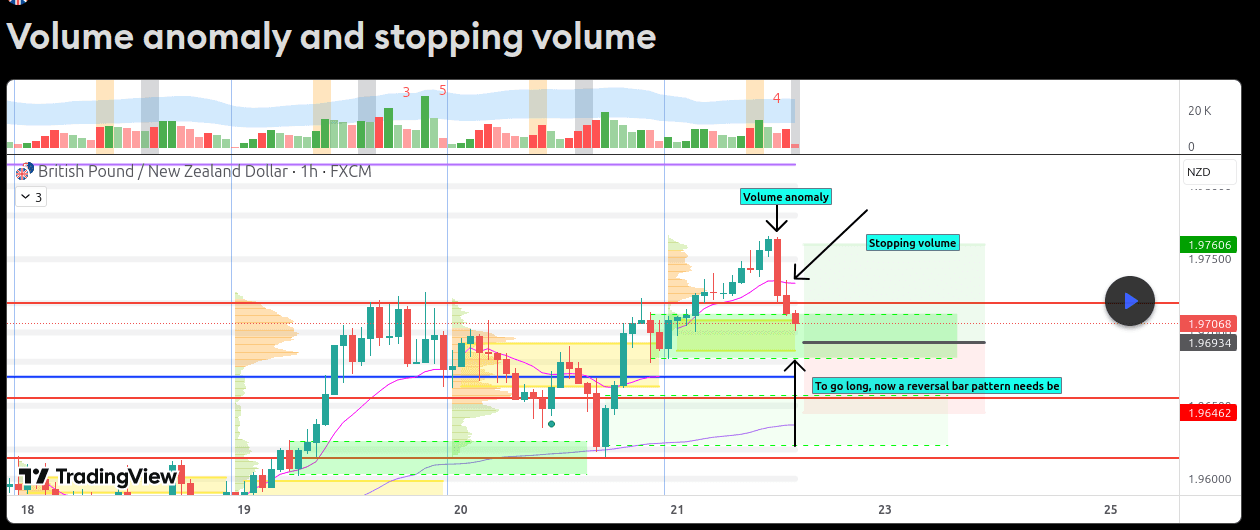
🔢 Volume Indicators
Indicators that analyze trading volume for confirmation
Volume Anomaly
Frequently Asked Questions — Trading Strategies & Indicators
What is Smart Money Concepts (SMC) in trading?
Smart Money Concepts (SMC) is a price action framework based on how institutional traders — banks, hedge funds, and market makers — move price. It focuses on Break of Structure (BOS), Change of Character (CHoCH), Order Blocks, Fair Value Gaps (FVG), and liquidity sweeps. SMC traders look for areas where institutions have placed large orders and align their trades accordingly, rather than relying on traditional retail indicators.
What is SMT Divergence and how do you trade it?
SMT (Smart Money Technique) Divergence occurs when two correlated assets — such as EUR/USD and GBP/USD — fail to confirm each other's highs or lows. For example, if EUR/USD makes a new high but GBP/USD does not, this divergence signals potential weakness and a likely reversal. Traders use SMT divergence to identify manipulation zones, confirm entries, and avoid stop-hunts engineered by institutional players.
What is a Fair Value Gap (FVG) in trading?
A Fair Value Gap (FVG) is a three-candle price imbalance where the first candle's high and the third candle's low do not overlap — leaving a gap that represents inefficiency in price. In Smart Money trading, these gaps often act as magnets that price revisits to 'fill' the imbalance. Traders use FVGs as entry zones for limit orders, expecting price to retrace into the gap before continuing in the original direction.
What is Turtle Soup strategy in forex?
Turtle Soup is a counter-trend strategy that exploits false breakouts — the same moves that would stop out traditional breakout traders. When price breaks above a previous high or below a previous low and then quickly reverses, Turtle Soup traders enter in the opposite direction. The setup targets institutional stop hunts and liquidity grabs, and is commonly used on daily and 4H charts in forex and indices.
How does Fibonacci Retracement work in trading?
Fibonacci retracement uses the mathematical ratios derived from the Fibonacci sequence (23.6%, 38.2%, 50%, 61.8%, 78.6%) to identify potential support and resistance levels within a pullback. After a significant price move, traders draw Fibonacci levels from the swing low to the swing high (or vice versa) and look for price to react at these levels before continuing in the trend direction. The 61.8% level — the 'golden ratio' — is considered the most significant.
What is the difference between a Maker and Taker order?
A maker order is a limit order that sits in the order book without immediately executing — it 'makes' liquidity. A taker order is a market order that executes immediately against existing orders — it 'takes' liquidity. Exchanges charge lower fees for maker orders to incentivise liquidity provision, and higher fees for taker orders. Most retail traders default to taker orders when they use market orders.
What timeframes work best for SMC trading?
SMC is applied across all timeframes using a top-down analysis approach. Traders typically use higher timeframes (Daily, H4, H1) to identify the overall trend, market structure, and major order blocks, then drop to lower timeframes (M15, M5, M1) to find precise entries such as FVGs, BOS confirmations, and entry triggers. The SSMT model uses M5 for Quarters, M1 for Sub-Quarters, and 30-second charts for Micro-Quarters.
What is a Break of Structure (BOS) in Smart Money trading?
A Break of Structure (BOS) occurs when price breaks beyond a significant swing high (bullish BOS) or swing low (bearish BOS), confirming the continuation of the current trend. A BOS signals that institutional order flow is aligned with the breakout direction. It is different from a Change of Character (CHoCH), which signals a potential trend reversal rather than continuation.
How do EMA crossovers work for trend trading?
EMA (Exponential Moving Average) crossovers occur when a shorter-period EMA crosses above or below a longer-period EMA. A bullish crossover (short EMA crosses above long EMA) signals upward momentum. The 7 EMA system used in this education hub aligns seven EMAs across different periods — when all align in order from shortest to longest, it signals strong directional momentum. Price retesting the EMA cluster after a crossover provides a high-probability entry.
Can I use these strategies for prop firm trading?
Yes — many of the strategies covered here, including SMC, SMT Divergence, Turtle Soup, and the SSMT model, were designed with institutional and prop firm trading in mind. They use defined risk-reward structures (typically 1:3 or better), clear rule-based entries, and multi-timeframe confirmation — all features that align with prop firm evaluation criteria such as low drawdown, disciplined execution, and consistent profitability.
Learn Professional Trading Strategies — Free
This trading education hub covers the full spectrum of institutional trading concepts: Smart Money Concepts (SMC), SMT Divergence, Sequential SMT (SSMT), Turtle Soup false breakout strategy, Fair Value Gaps (FVG), Break of Structure (BOS), Fibonacci retracement and extension, EMA cross systems, Alpha Trend momentum indicators, PDH/PDL breakout strategies, and volume anomaly detection. Each strategy includes a real chart example, entry and exit rules, and the timeframes it works best on — giving you a practical, institutional-grade education without the cost.
Ready to Put These Strategies into Practice?
Apply every strategy from this guide — SMT, SMC, Fibonacci, EMA, FVG and more — with live market data across forex, crypto, gold and indices.
Start Trading Now